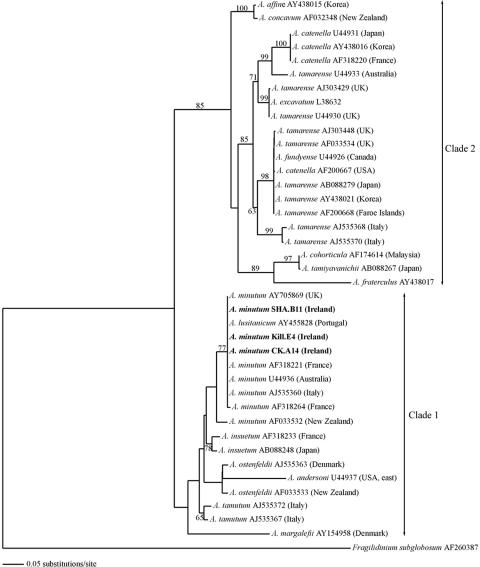
FIG. 4.
The most likely phylogenetic tree inferred from the maximum likelihood analysis of LSU rDNA sequences (D1-D2 domain). The optimal base substitution model derived from the Akaike information criterion in Modeltest 3.7 was a TIM+G model with the following constraining parameters for base frequencies, base substitution frequencies, proportion of invariable sites and gamma distribution shape parameter, respectively: A = 0.2569, C = 0.1639, G = 0.2543, T = 0.3249; A-C = 1.0000, A-G = 2.2110, A-T = 0.7666, C-G = 0.7666, C-T = 4.1370, G-T = 1.0000; I = 0; G = 0.6214. Numbers on the branches indicate branch frequency from 100 bootstrap replicates (values of <50% were not included).

