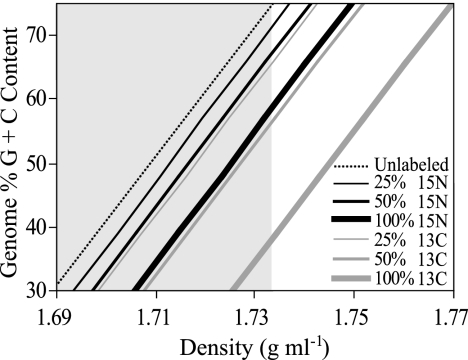
FIG. 1.
Expected relationship between genome G+C content and buoyant density in a CsCl gradient represented for unlabeled DNA and DNA that is partially or completely labeled with either 13C or 15N. The shaded region of the chart represents the range of densities over which unlabeled DNA would be expected to occur based on biologically meaningful values of genome G+C content (30% to 80% G+C content).

