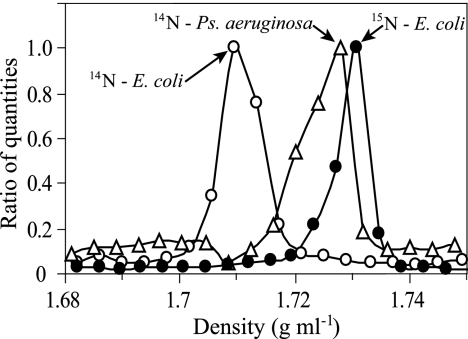
FIG. 2.
Effect of 15N enrichment and genome G+C content on DNA distribution in CsCl density gradients. Lines indicate the density of unlabeled E. coli DNA (○), 100% 15N-labeled E. coli DNA (•), or unlabeled P. aeruginosa DNA (▵). The genome G+C contents of E. coli and P. aeruginosa are approximately 51% and 67%, respectively.

