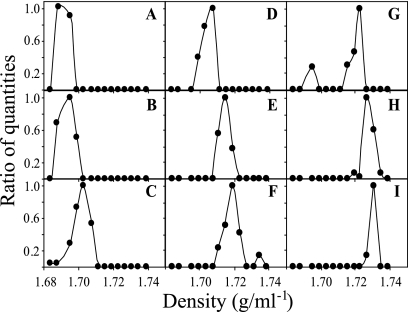
FIG. 3.
Fluorescence intensities of TRFs from soil DNA equilibrated in a CsCl density gradient and subjected to T-RFLP of 16S rRNA genes in gradient fractions. TRFs were selected to demonstrate that the buoyant densities of individual TRFs can vary between 1.69 g ml−1 and 1.73 g ml−1 in density gradients. Fluorescence intensity is shown as a ratio of the maximum value of fluorescence intensity that was observed for each TRF. The TRFs shown for panels A through I are 102 bp, 242 bp, 512 bp, 500 bp, 372 bp, 288 bp, 144 bp, 121 bp, and 177 bp, respectively.

