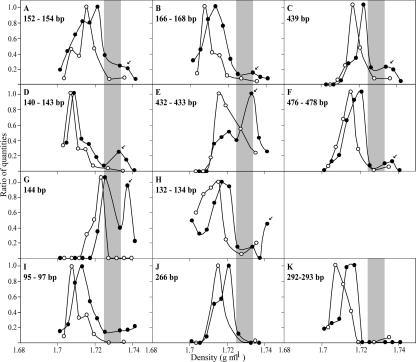
FIG. 3.
T-RFLP analysis of 16S rRNA genes was used to examine the buoyant densities of particular TRFs in primary gradient fractions. The TRFs shown are those predicted for cloned 16S rRNA gene sequences described in Table 1 and correspond to Rhodoplanes (A, B, and C), Betaproteobacteria (D, E, and F), unclassified Actinobacteria (G and H), and unclassified Acidobacteriacea (I, J, and K). Symbols correspond to DNA from soil with artificial air (○) or artificial air containing 99.8 atom% 15N2 (•). TRF peak height was normalized as a function of maximum peak height in each gradient. Arrows are used to indicate putative 15N-labeled DNA, and shading is used to represent DNA from fractions that were added to secondary gradients as described in the legend to Fig. 1.

