FIG. 2.
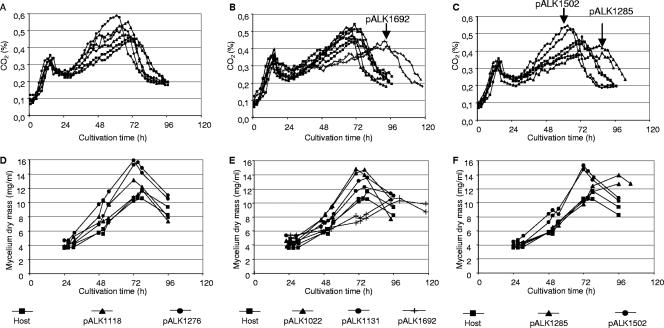
Growth of T. reesei transformants in laboratory fermentors. Two cultivations were performed for each strain. The changes in CO2 concentrations (A to C) and mycelium dry mass (D to F) during the cultivations are shown. The results from strains with fusion of xylanase to the Man5A signal sequence are shown in panels A and D, from strains with fusion to Man5A core/hinge in panels B and E, and from strains with fusion to the Cel6A CBD in panels C and F. Results from the ALKO3620 host strain are shown in all the graphs for comparison. The CO2 curves of strains with growth clearly different from that of the host are marked by arrows on graphs A to C. The growth of the strain with the expression cassette pALK1309 was similar to that of the strain with pALK1022 (not shown in panels B and E).

