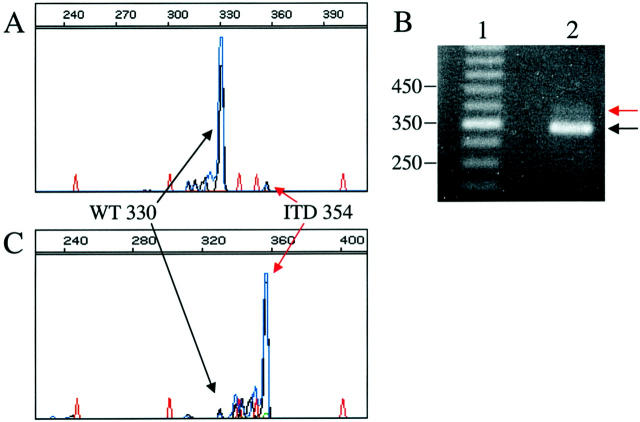
Figure 3.
Example of enrichment of a sample containing a small number of FLT3 ITD mutant allele PCR products because of a low blast count in the sample tested. A: CE pherogram; x axis represents size of the PCR product in bases, y axis represents relative fluorescence intensity. Red peaks represent internal size standard. Blue/black peaks are the FAM/NED-labeled products of the ITD portion of the multiplexed assay. The large wild-type peak at 330 bases and small ITD mutant peak at 354 bases are indicated by black and red arrows, respectively. B: PAGE of the same PCR product as in A. Lane 1 is a 50-bp marker. Lane 2 is the same sample analyzed by CE in A. The black arrow indicates the 330-bp wild-type product, and the red arrow indicates the 354-bp ITD mutant PCR product. C: CE electropherogram after band-stab of the ITD mutant band and reamplification. Note that after band-stab and reamplification, the FLT3 ITD mutant PCR products are dominant compared to wild type.

