
Figure 4.
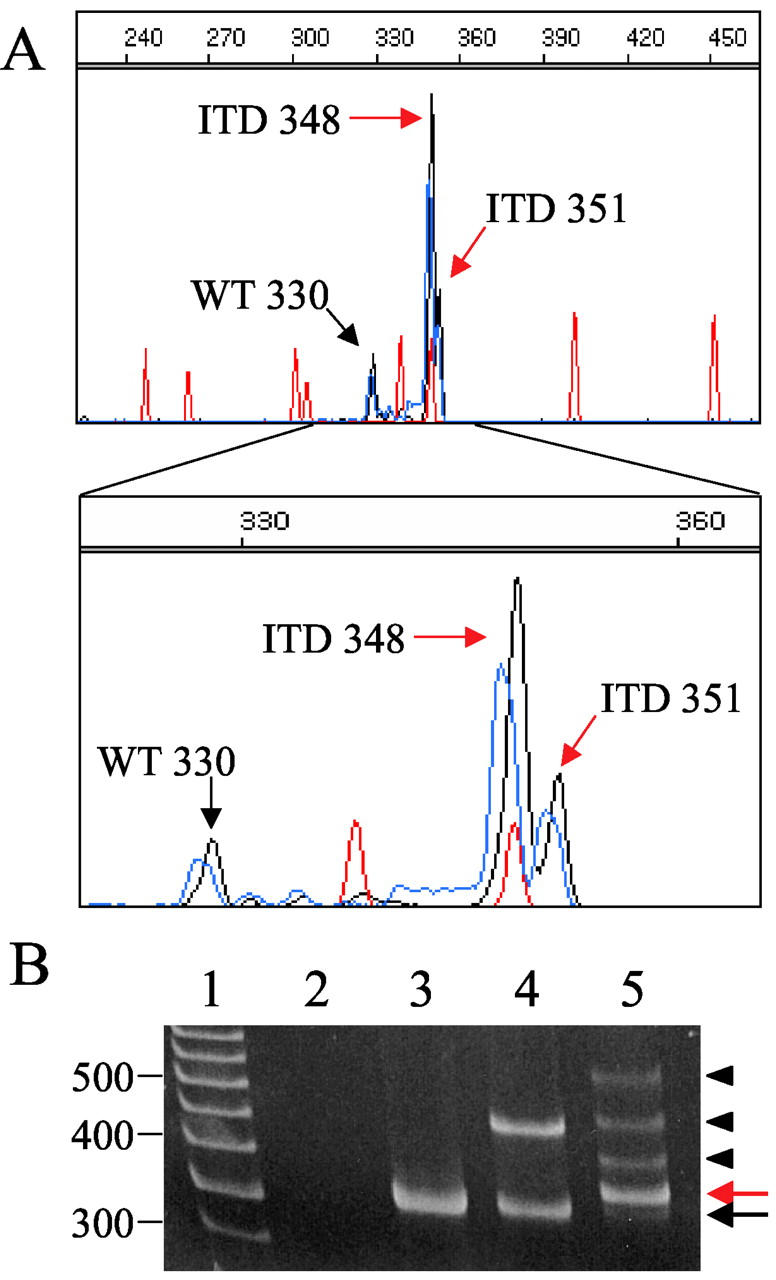
Example of improved resolution of CE compared to PAGE. A: CE pherogram of a sample positive for two different ITD mutations; x axis represents size of the PCR product in bases, y axis represents relative fluorescence intensity. Red peaks represent the internal size standard. The wild-type peak at 330 bases (black arrow) and two ITD mutant peaks at 348 and 351 bases (red arrows) are indicated. Below, the electropherogram is magnified to highlight the two different ITD mutations. B: PAGE of the same PCR product as in A. Lane 1 is a 50-bp marker, lane 2 is a no template control, lane 3 is a FLT3 wild-type control, lane 4 is a FLT3 ITD control, and lane 5 is the same sample as run by CE in A. The black arrow indicates the small amount of wild-type PCR product. The red arrow indicates the two ITD bands at 348 and 351 identified by CE. The arrowheads identify bands that are not detected by CE. These bands appear to be the result of heteroduplex formation between the two ITD products and between wild-type and ITD PCR products (see text).