
Figure 4.
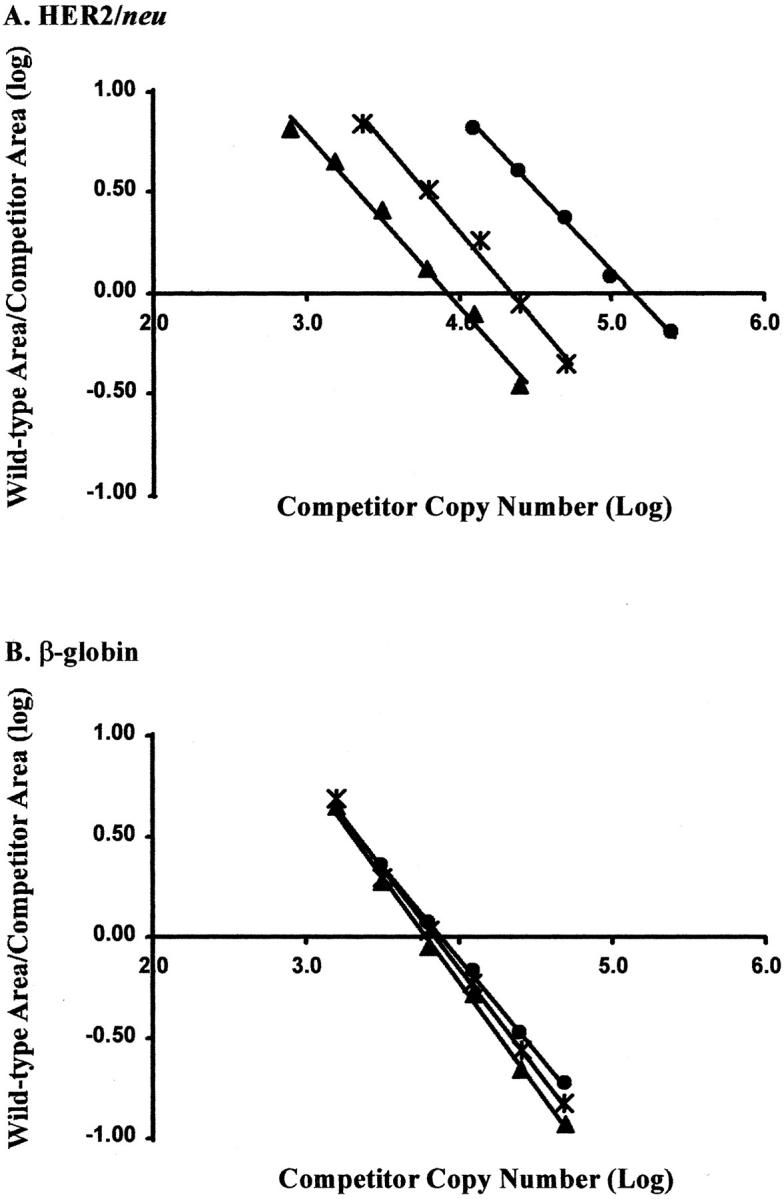
Wild-type:competitor area ratios. The wild-type and competitor area ratios were plotted against varying amounts of competitor copy number. The x-intercept is the calculated copy number in the sample. (▴) MRC-5; (∗) T47D; (▪) SKBR3. A: HER2/neu copy number differed depending on the amount of HER2/neu gene amplification. B: β-globin copy numbers were similar in the three cell lines.