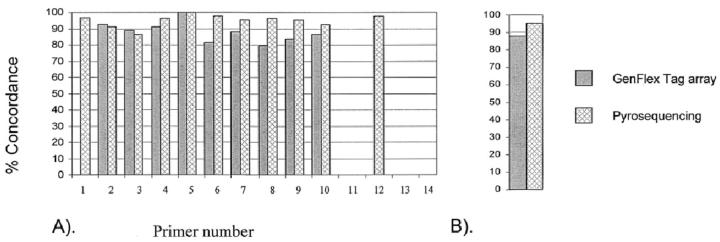
Figure 3.
Concordance of SNP genotypes from three analysis methods with the reference method. Number of SNPs corresponds to number in Table 2 . A: Height of the bars expresses the percentage of concordance of genotypes for each SNP with the reference method (minisequencing) genotype. The color coding of the bars indicate the assay platform. A lack of a bar indicates a non-working assay. B: The mean concordance of genotypes for all 14 SNPs combined for each platform, compared to the reference method. Color coding as in A.

