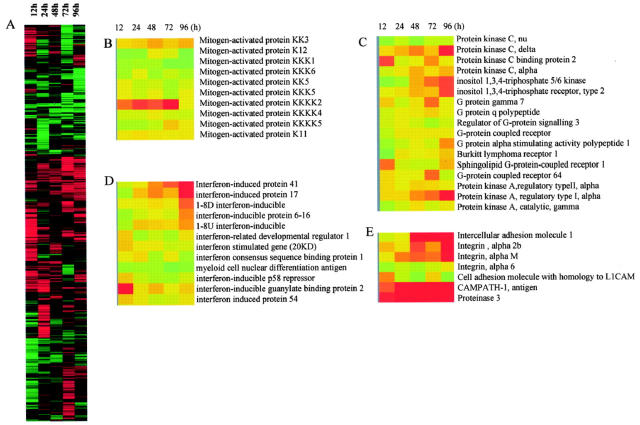
Figure 1.
Expression profiles of 12,288 genes in NB4 cells with or without ATRA (1 μmol/L) treatment. A: Hierarchical clustering of 12,288 genes based on their expression profiles in NB4 cells treated with ATRA at 12 hours, 24 hours, 48 hours, 72 hours, and 96 hours. Each row represents a single gene on the microarray, and each column a separated sample at a different time point. The expression profile of functionally related genes: mitogen activated protein kinase (B), protein kinase C and protein kinase A-related genes (C), IFN-induced genes (D), and neutrophil marker protein genes (E).

