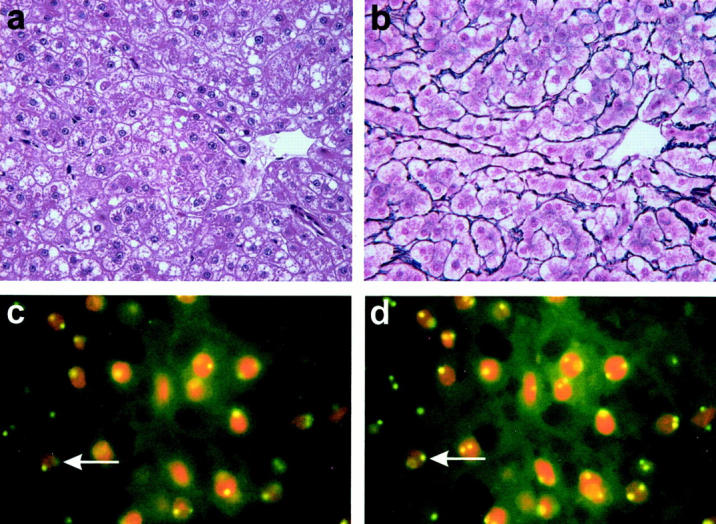
Figure 1.

H&E-stained section of case HCA 12 reveals variations in nuclear size and prominent nucleoli (a; original magnification, ×400). Silver stain demonstrates a preserved delicate network of reticulin fibers around the tumor cells (b; ×400). FISH for chromosome 6 gives a normal distribution of signals, as indicated by one or two fluorescent signals in the nuclei (c; ×1000). Due to cutting artifacts, not all nuclei are expected to bear two signals. The number of signals shown in this photograph, however, is too low, and varying the plane of focus for approximately 2 μm brings up additional signals, as indicated for an exemplary cell by an arrow (d; ×1000).
