
Figure 2.
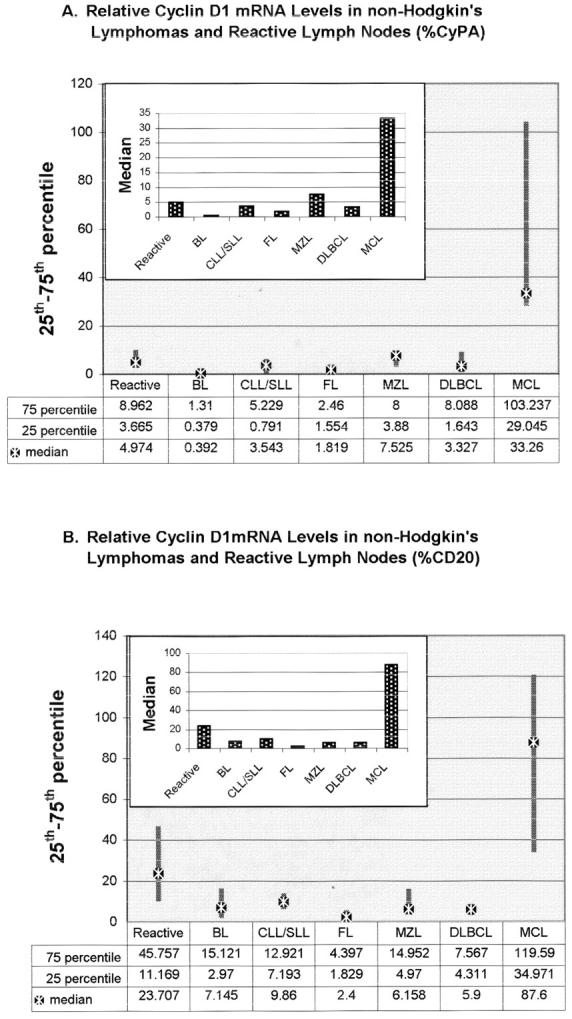
Relative cyclin D1 mRNA levels expressed as percentage of CyPA (A) or CD20 (B) mRNA copy number. The end points of the solid bars represent 25th and 75th percentile. Median is indicated by the star symbol. The inserted bar graphs show the median relative cyclin D1 mRNA levels for each normalizer (stippled bars).