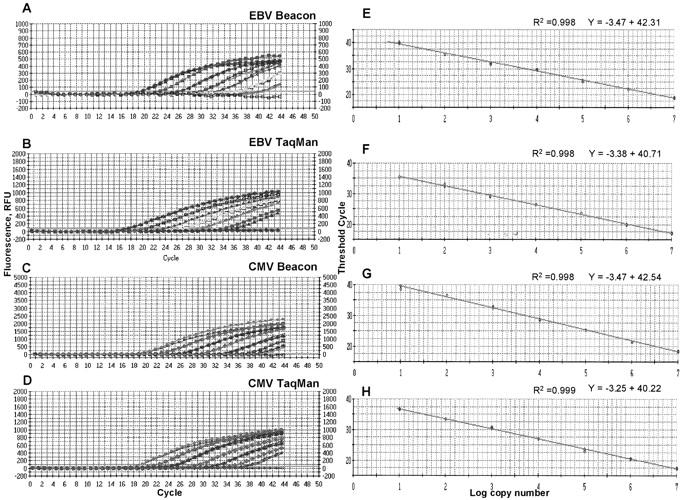
Figure 1.

Real-time PCR assays for the detection of EBV and CMV using molecular beacon or TaqMan probes. Amplification plots (A, B, C, D) and standard curves (E, F, G, H) of EBV and CMV real-time PCR. Tenfold serial dilutions of quantitative EBV and CMV DNA ranging from 107 to 101 copies/reaction were amplified in duplicate. Amplification plots show the detection of the serially diluted DNA. PCR cycles are plotted against the fluorescence intensity. The cycle at which the fluorescence reaches a threshold value is called the threshold cycle (Ct). Standard curves were obtained by plotting the Ct values against the copy number. The correlation coefficients and linear regression equations are shown.
