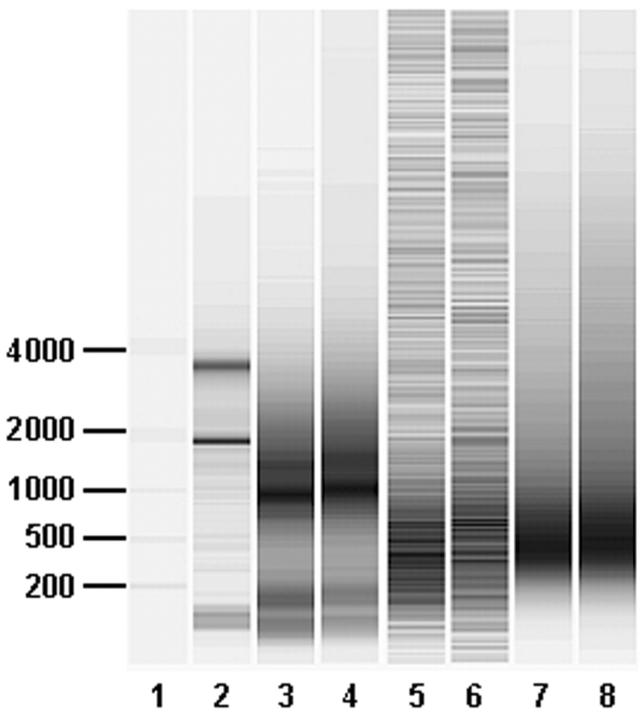
Figure 1.
Electrophoretic analysis of aRNA targets. One microliter of each cRNA target was analyzed on an RNA LabChip and Agilent bioanalyzer. Lane 1: Molecular weight ladder with marker sizes indicated in base pairs. Lane 2: Input breast cancer total cellular RNA used for target generation. Lanes 3 and 4: Duplicate targets synthesized using “Standard protocol (A)” and starting with 10 μg of total RNA. Lanes 5 and 6: Duplicate cRNA samples generated from 10 ng of total RNA after the first round of amplification using the “RiboAmp Two-Round (D)” protocol. Lanes 7 and 8: Duplicate aRNA samples generated from 10 ng of total RNA after the second round of amplification using the “RiboAmp Two-Round (D)” protocol. To simultaneously visualize cRNA after both first and second rounds of amplification, the signal intensity in each lane has been scaled to itself so that lane-to-lane quantitative comparisons are not valid. Background bands in lanes 5 and 6 are system noise that is detected due to the low specific signal obtained from the first round amplification cRNA product.

