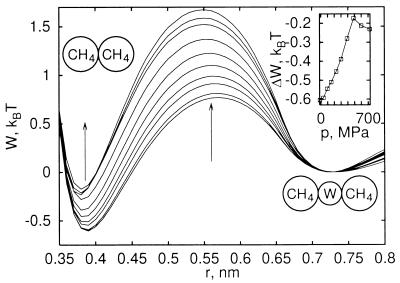
Figure 2.
Pmf for methane association for varying pressure, including Lennard–Jones and solvent contributions. Results are shown for pressures between −16 and 725 MPa, where arrows indicate changes with increasing pressure. (Inset) Difference in free energy between the contact (r ≈ 0.39 nm) and solvent-separated minimum (r ≈ 0.73 nm) as a function of pressure. Equilibrium of those two states would also involve an ideal contribution −ln(r2/r1)2 deriving from relative volume changes of spherical shells. Note that the stable contact minimum moves inward slightly with increasing pressure.

