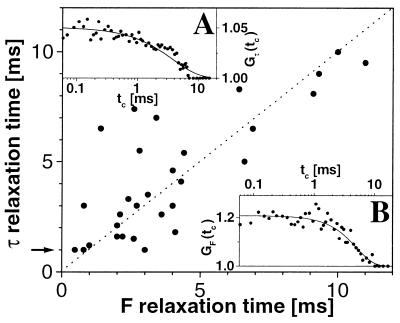
Figure 7.
Comparison of the relaxation times obtained by F- and τ-autocorrelation analysis of the various bursts. The arrow on the y axis gives an estimate for the achievable time resolution of Gτ(tc) because of correlated statistical noise. (Insets) Normalized autocorrelation curves Gτ(tc) (A) and GF(tc) (B). Fit to Eq. 3 with a single relaxation correlation time ω. (A) ωτ = 4 ms, Gτ(0) = 0.04. (B) ωF = 5 ms, GF(0) = 0.22.

