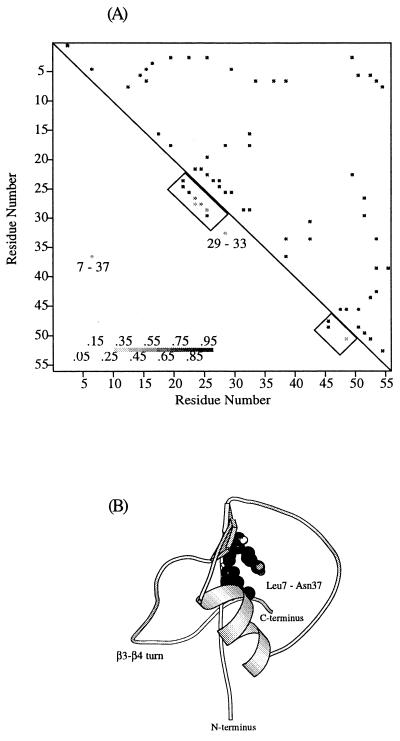
Figure 2.
(A) Contact maps for the native state and the initial stage of GB1 folding. Fifty-four native contacts are shown above the diagonal of the contact map, and the subset of native contacts present in the early stage of folding are shown below the diagonal. Only contacts occurring with a high probability (P > 50%) are shown, the gray scale indicates the probability for a particular contact to be formed. (B) Representative structure of GB1 during early stages of folding.

