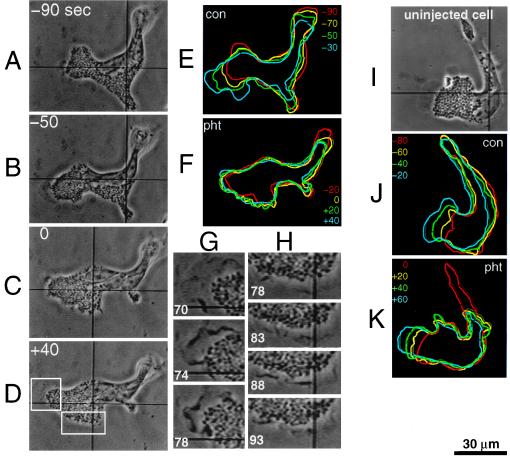
Figure 3.
Acute paralysis of locomotion after photorelease of the calmodulin inhibitory peptide from 5cgY-RS-20. (A–D) Phase contrast images before (−40 and −20) and after (+40, +80, and +120) near-UV exposure (0) with times in sec. (E and F) Color-coded outlines showing cell movements at 20-sec intervals during the 5-min control period (“con”) and immediately after release of the peptide (“pht”). The cell outline 5 min after photolysis was virtually identical to that 40–60 sec after photolysis. (G and H) Enlargements of boxed areas in D showing continued edge ruffling 70–93 sec after peptide release. (I-K) Phase contrast images and outlines of a control cell and its lamellipods at 20-sec intervals before (“con”) and after (“pht”) the same near-UV light exposure used in A-D.

