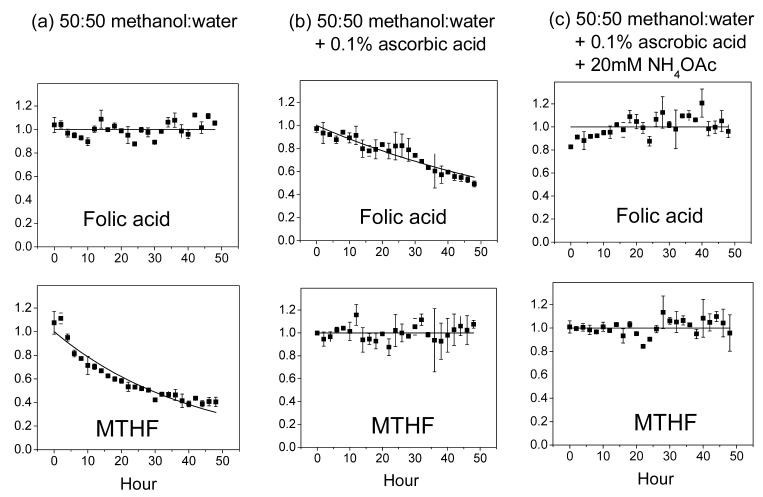
Fig. 1.
Representative compound stability traces. The top panel shows PteGlu (folic acid) and the bottom 5-CH3-H4PteGlu (MTHF), whose stabilities were measured in the indicated solvent systems. Each solid square is the average of two independent experiments, with the error bar being ± one standard error of the mean. The data is fit to single-exponential decay function, except when there is no obvious decay (in which case the line is for illustration purposes only).

