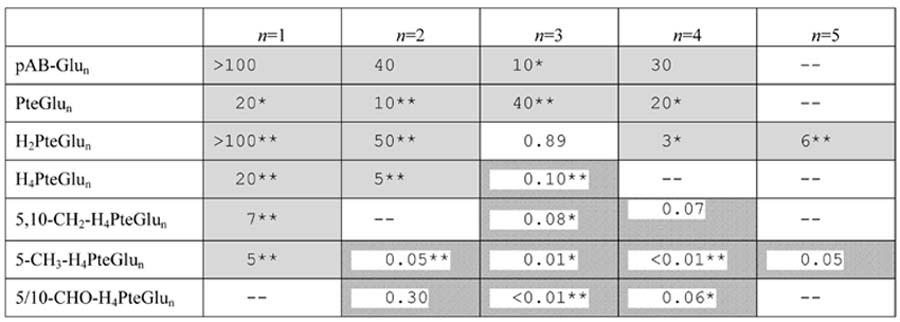
Table 6.
Effect of the DHFR inhibitor trimethoprim on the folate pools of E. coli. The overall experimental design is shown schematically in Fig. 5. Values in the table indicate fold-change in the level of the indicated folate species upon exposure of E. coli to 4 μg/mL trimethoprim for 1 h. Fold change = (peak height in drug-treated sample) / (peak height in the untreated sample). In cases where the signal in one condition is below the LOD, this signal was considered to be 100 ion counts, the typical LOD. Shaded boxes indicate significantly increased signal (p < 0.05) while hatched boxes indicate significantly decreased signal. “--” indicates that the compound was not quantifiable in either the drug-treated or untreated sample. Highly statistically significant results are highlighted by * (p < 0.01) or ** (p < 0.001).

