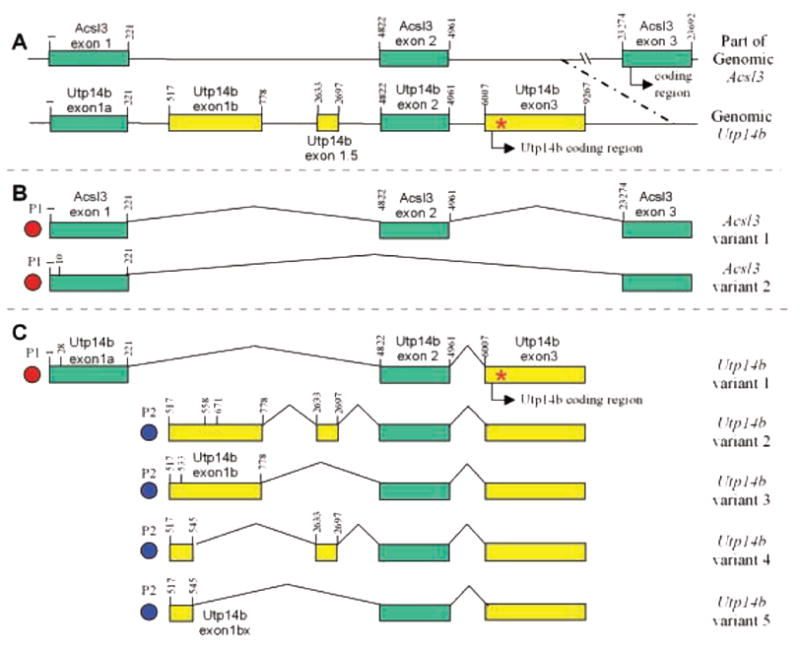
Fig. 1.

(A) Genomic maps of Acsl3 and Utp14b (not drawn to scale) showing the exons that can be included in transcripts. (B) Transcripts of Acsl3 observed by 5′-RACE. (C) Transcripts of Utp14b observed by 5′-RACE. The nucleotide numbers of the exon boundaries, relative to the major transcriptional start site of Acsl3 and Utp14b variant 1, are indicated vertically above the exons. Downstream alternative transcription start sites, differing by more than a few base pairs, are indicated as vertical lines with nucleotide number within the first exon of the transcript. P1, P2: putative promoters. *Utp14b mutation site for jsd phenotype.
