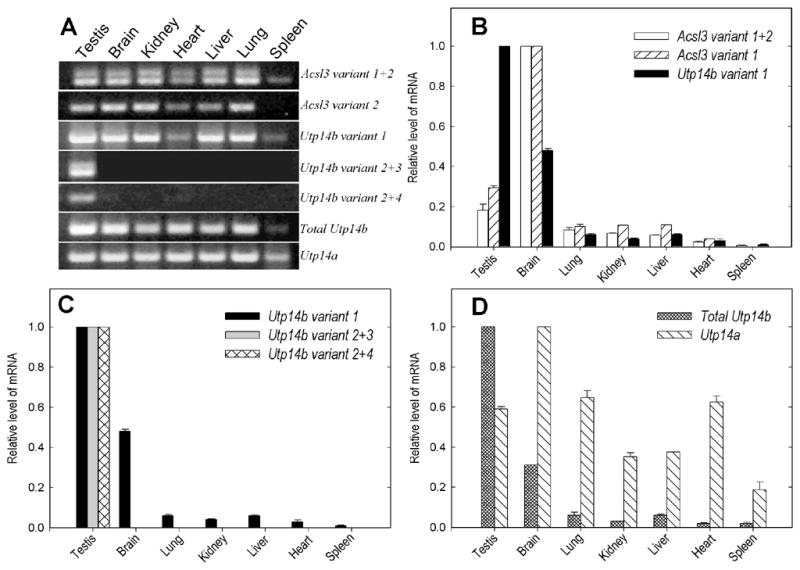
Fig. 2.

Tissue-specific expression of Acsl3, Utp14b, and Utp14a. (A) Agarose gel electrophoresis analysis of transcript-specific RT-PCR products taken from products of real-time PCR (40 cycles). (B–D) Tissue-specific transcript levels determined by real time-PCR. Expression of (B) Acsl3 (variants 1 and 2) and Utp14b variant 1, (C) Utp14b variant 1, variants 2+3 and variants 2+4, and (D) total Utp14b and Utp14a. Expression levels were first normalized to ribosomal protein Rps2 mRNA levels, and then the values for the tissues with the most abundant expression were set at 1.0.
