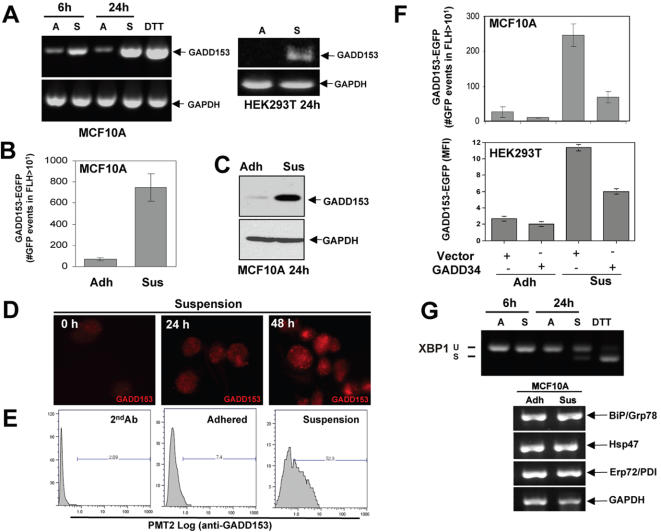
Figure 3. GADD153 mRNA and Protein Levels Are Strongly Upregulated During Suspension Conditions.
(A) RT-PCR analysis of GADD153 mRNA levels in MCF10A (left panel) and HEK293T (right panel) cells at different time points in either adhered (A) or suspended (S) conditions. Adhered MCF10A cells treated with 2mM DTT for 4h were used as positive control and GAPDH was used as a loading control. (B) MCF10A cells were transiently transfected with a GADD153 promoter-driven-EGFP reporter plasmid and EGFP fluorescence was analyzed 48 h post-transfection by FACS; total events captured: 2×10⁴. The graph shows the number of GFP-positive events in FLH2>10 (mean±SD). (C) Western blot for GADD153 protein in adhered (A) or suspended (S) MCF10A cells. (D and E) Immunofluorescence (D) and FACS (E) analysis of GADD153 (red) expression in MCF10A cells following growth in adhered or suspension conditions for the indicated times. Secondary antibody was used as negative control in E. (F) MCF10A (top) and HEK293T (lower) cells were transiently co-transfected with the GADD153-EGFP reporter plasmid and either a full-length Flag-tagged GADD34 plasmid or an empty vector as control for 24 hrs before being detached and left to reattach or put into suspension for an additional 48 hrs before FACS analysis. GFP fluorescence was analyzed 48 h post transfection by FACS where a total 2×10⁴ events were captured. The graphs show the number of GFP positive events in FLH2>10 or the mean fluorescence intensity (MFI) in the PMT2-FITC channel (mean±SD). (G) RT-PCR for XBP-1 splicing (top panel) in MCF10A cells at different time points either adhered (A) or suspended (S). Adhered MCF10A cells treated with 2mM DTT for 4 hrs was used as positive control and GAPDH, shown in (A) was used as a loading control. Lower panels show RT-PCR for BiP, Hsp47 and Erp72/PDI chaperone mRNA levels in adhered (Adh) or suspended (Sus) MCF10A cells. GAPDH was used as a loading control.

