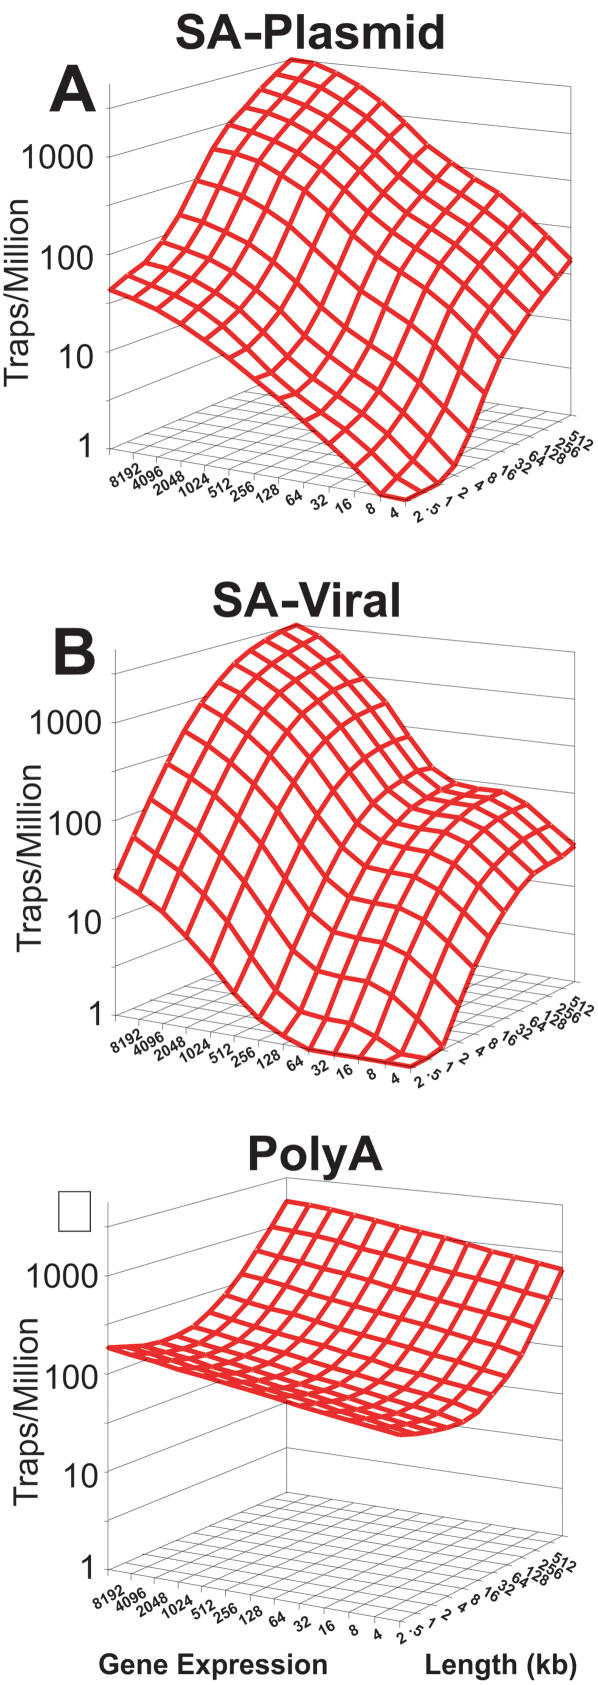
Figure 3. Models of trap likelihood for gene-trap vectors.
Models of the likelihood of trapping a gene with particular length (x-axis) and expression (y-axis) values for each gene-trap event were created through an iterative process, in which outliers (P<0.001) were removed before the final model was created. Probability (z-axis) is given as events per million traps.

