
Figure 2. Imaging of glutamate-induced degeneration of rat primary cortical neurons and protection by α-tocotrienol and BL15.
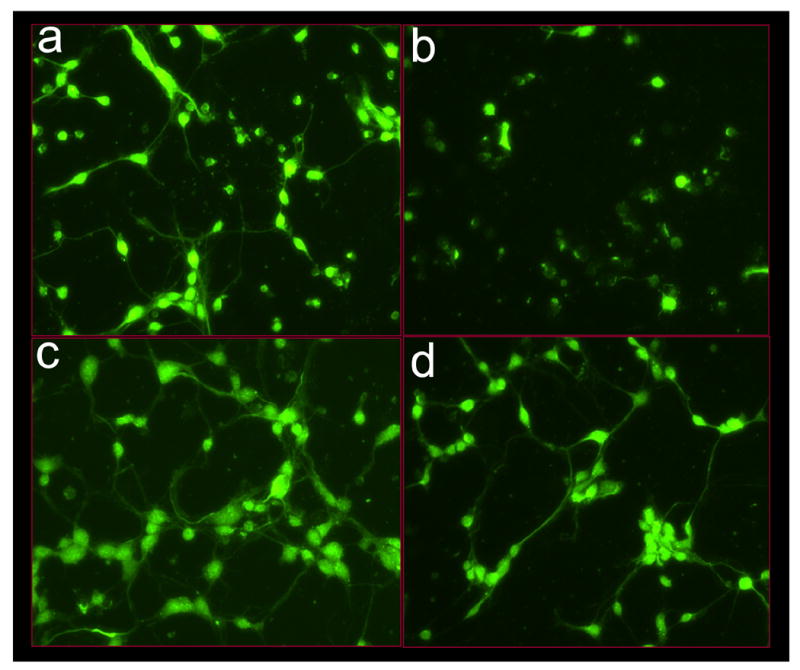
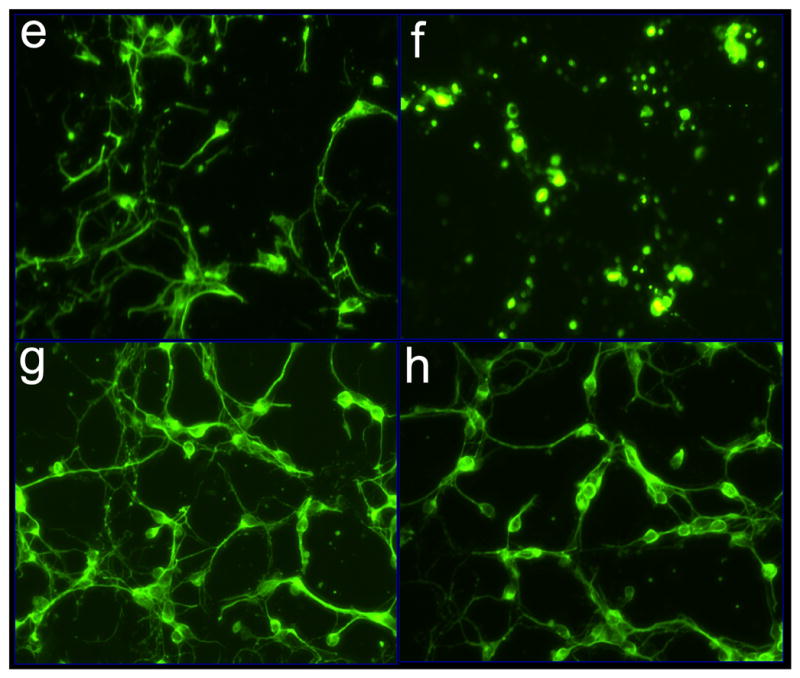
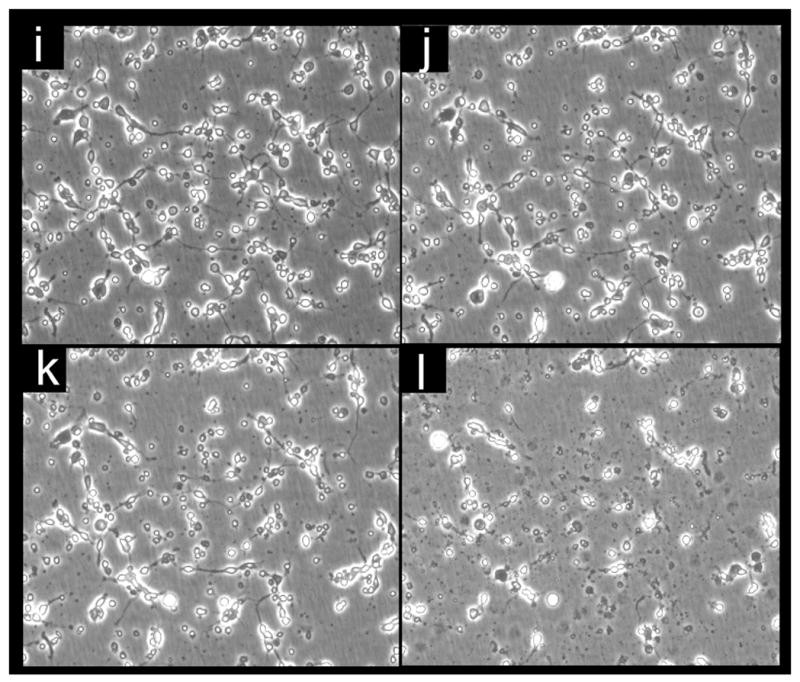
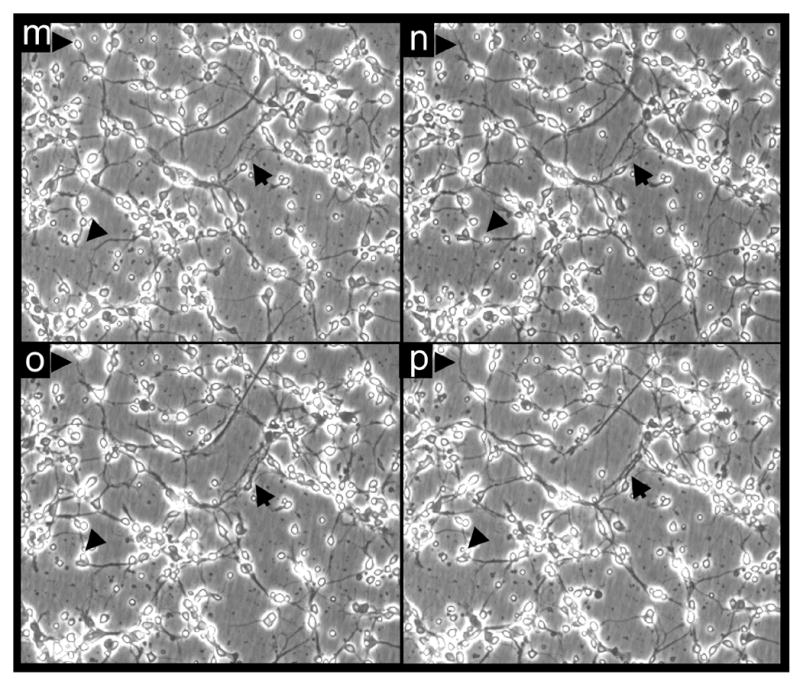
After 24h of seeding, cells were challenged with glutamate. Where indicated, neurons were pre-treated with either α-tocotrienol (250 nM) or BL15 (2.5 μM) for 5 min prior to glutamate treatment. a-h, Neuron specific Class III β-tubulin in the cultured neural network (for phase contrast microscopy see i-p). After 24h of glutamate treatment, cells were fixed and stained. a, control; b, glutamate; c, α-tocotrienol + glutamate; d, BL15+glutamate. e-h, Neurofilament staining in the cultured neural network (for phase contrast microscopy see i-p). e, control; f, glutamate; g, α-tocotrienol + glutamate; h, BL15+glutamate. i-p, Live cell imaging of glutamate treated neurons under standard ( not glass cover-slip) culture conditions. Phase contrast images were collected once every 15 mins for 18h from 8h after glutamate treatment. Frames illustrate time-dependent disintegration of the neural network. i, 8h; j, 12h; k, 16h; and l, 26h after glutamate treatment. Glutamate-challenged neurons pre-treated with α-tocotrienol (250 nM) resisted degeneration and continued to grow. m, 28h; n, 30h; o, 32h; and p, 34h after glutamate treatment. Two (i-l and m-p) .avi video micrographs have been supplemented for online publication. 200X magnification.