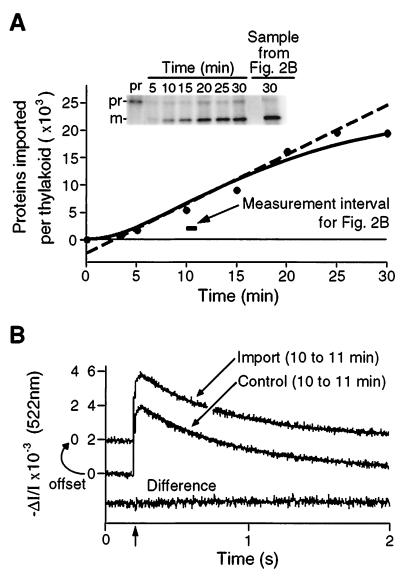
Figure 2.
Simultaneous measurement of protein translocation and carotenoid absorbance change transients demonstrates that proteins are transported by ion-tight translocators. (A) Time course of prOE17 import. Saturating concentrations of transport substrate (40 nM) imported at a rate of approximately 900 precursors per thylakoid per min under spectrophotometric measurement conditions. The required ΔpH was established by 522-nm illumination. The solid line is a fit of the data to an irreversible two-step first-order reaction mechanism. The dashed line is the slope of the tangent at the inflection point of the solid curve and serves to define the maximal rate of protein import (906 proteins per min per thylakoid) and the minimal crossing time for prOE17, where the line intersects the abscissa (2.7 min). (B) Electric-field-induced absorbance change transients recorded between 10 and 11 min after precursor addition (horizontal bar in A) display identical decay rates to those transients recorded with thylakoids not engaged in protein translocation. Traces were recorded before addition of either prOE17 (import sample) or urea alone (control) and thereafter for a full 30 min to assess the electrical conductivity of the membrane during protein translocation. Urea alone had no effect on conductance (data not shown). After 30 min, protein transport in the experimental sample was assessed as in A; this is shown in the last lane in the gel in the Inset. The decay traces were fit to monophasic exponentials (solid lines); half-time of decay was 0.44 s for the protein import trace and was 0.47 s for the control trace. The lower trace is the difference between the two above and indicates that they are essentially identical.

