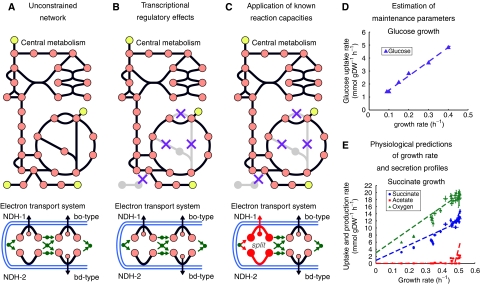
Figure 3.
Utilizing iAF1260 as a predictive model. (A) A drawing of central metabolism and the ETS included in iAF1260. Originally, the entire network is unconstrained. (B) Application of transcriptional regulatory effects restricts the total number of pathways, or routes, flux can pass through in the network. (C) Further application of known reaction capacities can result in more accurate predictions. For example, the flux through the NADH dehydrogenase enzymes is split in a 1:1 ratio during a simulation to produce an optimal P/O ratio of approximately 1.4 (Gennis and Stewart, 1996; Noguchi et al, 2004). (D) The non-metabolic activity of the cell can be accounted for through maintenance parameters and these were approximated using experimental data under known media conditions. Chemostat data (see Materials and methods) was used (triangles) and the dotted line shows the modeling predictions with the appropriate maintenance parameters. (E) After the parameters are approximated, the model can then be used to predict the GR (circles), product formation (acetate, squares) and additional uptake rates (oxygen, triangles) under different environmental conditions (for succinate growth in this case).

