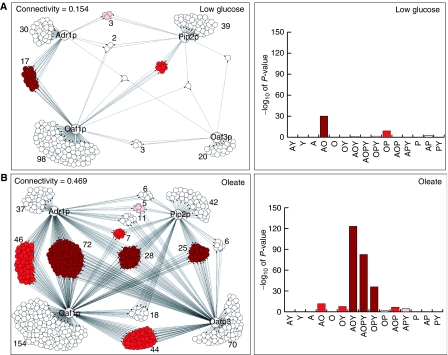
Figure 1.
Identification of overrepresented multiple input network motifs in the presence of low glucose (A) and 5 h after a switch to oleate (B). Left panels are condition-specific physical interaction networks between regulators (labeled nodes) and the intergenic regions with which they interact (unlabeled nodes) identified by large-scale genome localization analysis. Protein–DNA interactions (FDR of 0.001) for the four transcriptional regulators are shown as directed edges. Intergenic regions with same network topology (i.e. targeted by the same group of factors) are clustered and the number of targets per cluster is given beside each cluster. The network expands and there is more combinatorial control in the presence of oleate. Right panels are bar graphs showing the significance of overrepresentation for each cluster. On each graph, each cluster is labeled with up to four letters, representing the regulators targeting the cluster under that condition (A, Adr1p; O, Oaf1p; P, Pip2p; Y, Oaf3p). Overrepresented clusters have bars, the height of which reflects the significance of enrichment of that cluster in the network; note that as the P-values have been converted to significance scores (−log10(P-value)), one unit on the scale corresponds to a 10-fold difference in P-value. In all panels, significantly overrepresented topology clusters are colored in shades of red. Clusters with P-values of less than 1 × 10⁻²⁵, 1 × 10⁻⁵ and 1 × 10⁻² (significance scores greater than 25, 5 and 2) are colored dark red, red and pink, respectively.

