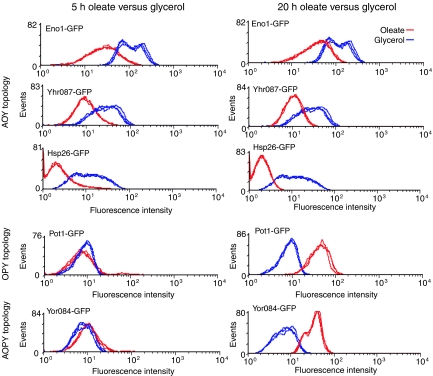
Figure 6.
Sequential changes in protein levels reflect coordination of responses by the network. FACS analysis of various GFP-tagged strains corresponding to genes under combinatorial control in the oleate network (topologies listed on the left). For each strain, fluorescence intensities of cells grown in glycerol (blue curves) were compared to those induced in oleate for 5 or 20 h (red curves). Protein levels corresponding to genes of the AOY topology are reduced in the presence of oleate, whereas those corresponding to genes with AOPY and OPY topologies increase after oleate induction. The negative effect of oleate on AOY gene expression is apparent after short and long induction periods, whereas the upregulation of gene targeted by Oaf1p and Pip2p is observed only after long induction periods.

