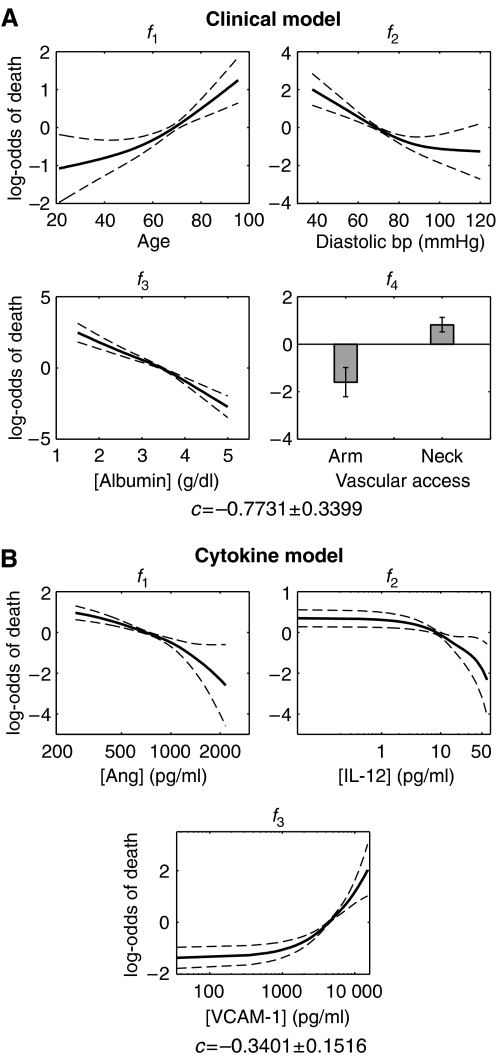
Figure 2.
Generalized additive models. (A) Model built using the clinical variables that represent the best four-variable model. (B) Model built using the cytokine levels that represent the best three-variable model. The solid lines are the mean of 100 bootstrap samples and the dashed lines show the variance. Numerical values for the mean curves are provided as Supplementary information.

