Figure 1.
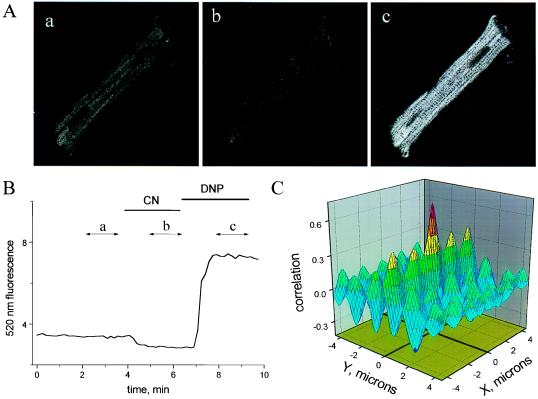
Mitochondrial redox in a cardiomyocyte. (A, a–c) Confocal images of endogenous flavoprotein fluorescence in the control (10 mM glucose-containing modified Tyrode’s; A, a), fully reduced (4 mM cyanide; A, b), and fully oxidized (200 μM 2,4-dinitrophenol; A, c) states. Each image was the average of 10 frames taken during the time segments shown in B (labeled a, b, c). Pixel brightness increases with oxidation of the mitochondrial flavoproteins. The spacing of the sarcomeric z-lines (transverse dark bands in A, c) is ≈1.8 μm, giving an internal scale of the images. (B) The time course of mean cell autofluorescence intensity change (arbitrary units) under fully reduced (cyanide) or oxidized (2,4-dinitrophenol) conditions. Image frames in the series were collected ≈10 sec apart. (C) Cross-correlation plot for simultaneously collected flavoprotein and TMRE fluorescence images (images not shown, but similar to Fig. 5A, a) demonstrating localization of the redox signal to the mitochondrial matrix.

