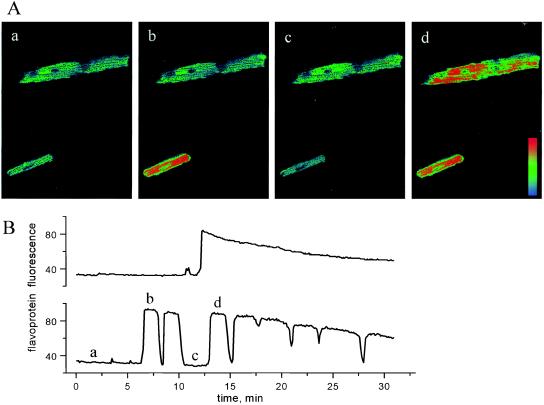
Figure 2.
Oscillations in mitochondrial redox potential in zero-glucose medium. (A, a–d) Confocal images of flavoprotein redox oscillations (lower cell) or a transition from reduced to oxidized (upper cell). Each image was the average of 10 taken during the time segments shown in B (labeled a, b, c, d). A pseudocolor palette graded from light blue (reduced) to red (oxidized) was applied. Note the local oxidation of a mitochondrial cluster at the right end of the upper myocyte in A, c. (B) The time course of mean cell fluorescence change (arbitrary units) during mitochondrial redox oscillation (lower plot corresponds to the lower cell in images shown in A) or a maintained transition of redox (upper plot corresponds to upper cell in A). The decline in fluorescence maxima late in the series is due to photobleaching. Frames were collected ≈6 sec apart.

