
Figure 3.
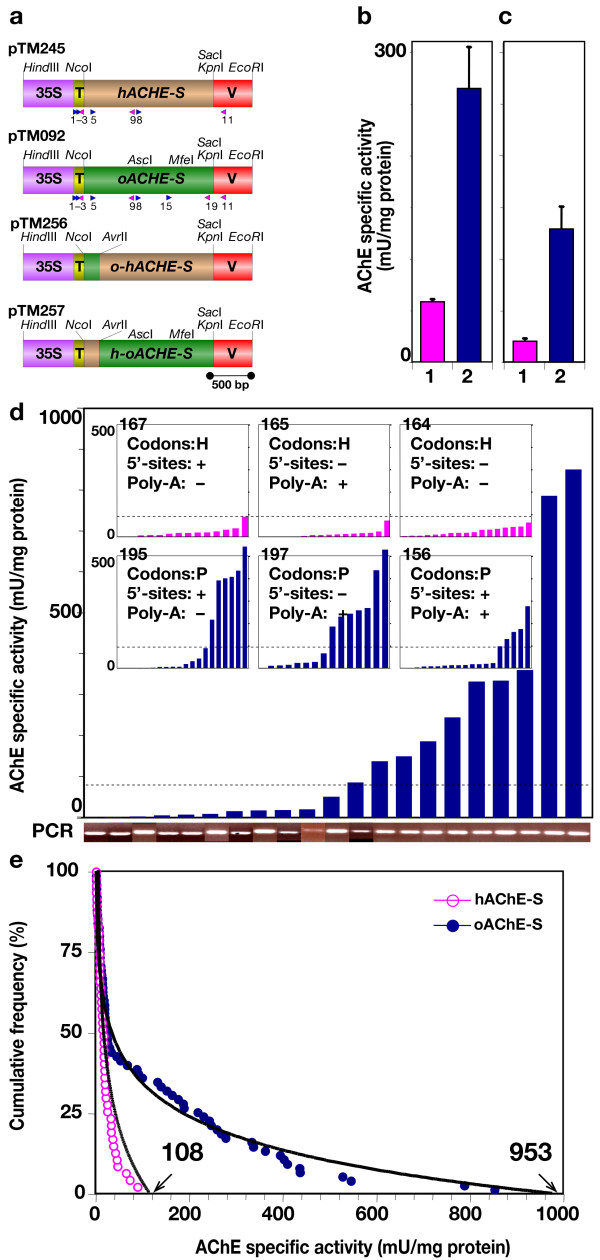
Optimization of transgene enhances AChE accumulation in plants. (A) Plant expression cassettes used in this study. pTM245 driving the expression of hACHE-S. pTM092 driving the expression of oACHE-S. pTM256 driving mosaic o-hAChE-S. pTM257 driving the expression of mosaic h-oAChE-S. 35S, CaMV 35S promoter; T, TEV leader; V, VSP terminator. Arrow heads, positions of oligonucleotides used in this for making probes, genomic PCR and RT-PCR (numbers refer to Table 2). (B) Transient expression assays in A. tumefaciens-infiltrated leaves of N. benthamiana plants. 1, hACHE-S; 2, oACHES. Averages of 6 replicates (means ± SEM) are shown. (C) N. benthamiana plants were stably transformed to express (1) hACHE-S or (2) oACHE-S. Individual lines were screened at least 2 times. Averages of all lines (presented in Panel D) with detectible levels of AChE (means ± SEM) are shown. (D) AChE accumulation levels in individual genomic-PCR positive plant lines expressing oACHE-S. Top inserts: AChE accumulation levels in individual plant lines expressing variants of hACHE-S: pTM167, pTM165 and pTM164. Bottom inserts: AChE accumulation levels in individual plant lines expressing variants of oACHE-S: pTM195, pTM197 and pTM156. Broken lines illustrate the maximal level of expression obtained with any of the hACHE-S lines. DNA fragments were PCR amplified from total DNA isolated from the indicated plant lines with oACHE specific primers (oTM126 and oTM047) and were resolved by agarose gel electrophoresis (denoted PCR). (E) Cumulative frequency distribution of the AChE expression data of lines shown in Panel D (high to low) can be fitted with the following logarithmic regression equations: hACHE-S, y = -22.967Ln (x) + 107.63 (r2 = 0.90); oACHE-S: y = -15.013Ln (x) + 102.99 (r2= 0.98).