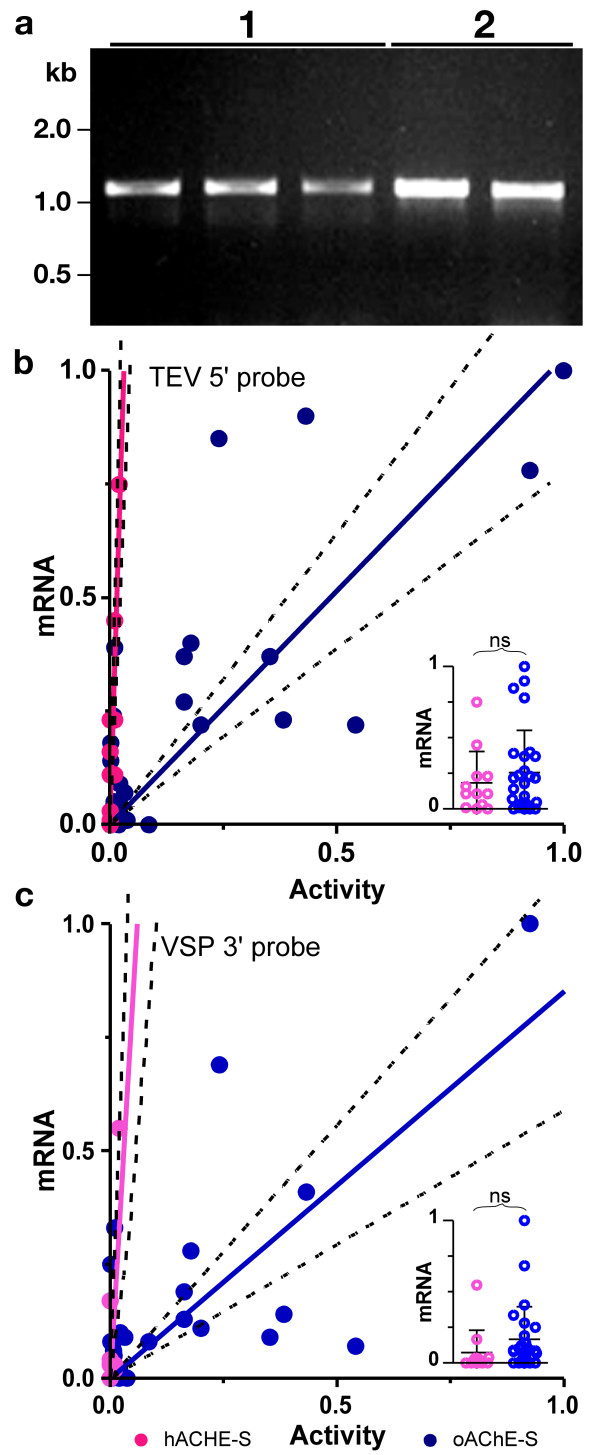
Figure 4.

Full-length hACHE-S and oACHE-S transcripts accumulate to similar levels. (A) RT-PCR amplification of ACHE transcript region potentially subjected to aberrant splicing. cDNA prepared from three lines of hACHE-S-R177W plants (1) and two lines of oACHE-S plants (2) were subjected to PCR amplification using the primers oTM089 and oTM049 and then resolved by agarose gel electrophoresis. Primers were selected to amplify the region potentially subjected to alternative splicing. Unspliced transcripts are expected to yield 1.1 kb fragment. If either of the two potential 5'- and 3'-intron splice sites were extensively utilized in plants harboring hACHE-S, shorter fragments of ~0.9 kb and ~0.5 kb are expected to be preferentially amplified. However, the full-length species clearly dominates. (B-C) Correlation between ACHE transcript accumulation and AChE enzyme activity. Transcripts levels of optimized (pTM092) and non-optimized (pTM050) measured by quantitative real time RT-PCR and were scored relative to 18S rRNA. Probes were designed for the two common regions of the two types of ACHE transcripts – (B) the 5'-UTR (TEV leader) and (C) the 3'-UTR (VSP terminator, upstream of the poly-A tail). Data obtained for multiple replicates was averaged and correlated with the respective AChE activity (normalized to the maximum level). When probed by the 5'-UTR probe, the correlation was highly significant with r2 = 0.72 (P < 0.0001) for the non-optimized sequence and r2 = 0.61 (P = 0.0005) for the optimized sequence. When probed by the 3'-UTR probe, the correlation was significant for the non-optimized sequence with r2 = 0.48 (P = 0.0122) and highly significant with r2 = 0.49 (P < 0.0001) for the optimized sequence. Inserts show scatter plots demonstrating the distribution of transcript levels in plants expressing hACHE-S and oACHE-S constructs. Each plant is depicted by a symbol and the mean ± S.D. are plotted. The groups are not statistically different by an unpaired t test (5'-UTR probe: P > 0.45; 3'-UTR probe: P > 0.22).
