
FIGURE 2—
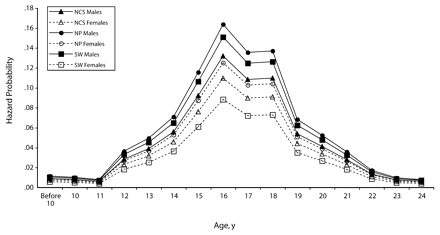
Marijuana initiation hazard curves for those born from 1960–1976 in the Northern Plains (NP) and Southwest tribes (SW) and a national sample: American Indian Service Utilization, Psychiatric Epidemiology, Risk and Protective Factors Project (AI-SUPERPFP), 1997–1999, and the National Comorbidity Survey (NCS), 1990–1992.