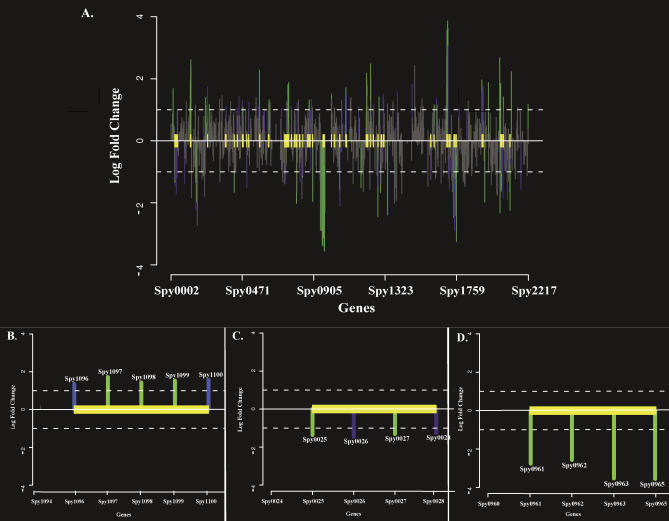
Figure 2. Statistically Significant Neighbor Clusters in the SF370 Genome.
Neighbor clusters that adhere to the definition of neighbor clusters are plotted by GenomeSpyer. Yellow boxes denote boundaries of significant neighbor clusters (P K value < 0.05). Genes, located on the x-axis, are identified by their Spy numbers from the annotated SF370 genome (deleted gene numbers result during genome updates); log2-fold change in expression values (adherence versus associated streptococci) are indicated on the y-axis. Genes designated by green lines have statistically significant P F values (log2-fold change P values < 0.05) and P E values (expression P values < 0.05). Genes designated by blue lines do not have statistically significant P F values, but as a result of membership in a designated neighbor cluster have statistically significant P E values (P E values < 0.05). Genes designated by gray lines do not have statistically significant P F or P E values.
(A) Whole-genome view of 47 statistically significant neighbor clusters identified in the SF370 genome during adherence to pharyngeal cells.
(B) Enlarged view of representative Type I cluster encoding folate biosynthesis genes (spy1096–1100). Type I clusters contain only genes of known or defined function. See text for further descriptions of all clusters. Spy numbers are indicated above the bars corresponding to each gene.
(C) Enlarged view of representative Type II cluster containing spy0127–0130. Type II clusters contain a combination of both functionally defined and unknown gene members.
(D) Enlarged view of representative Type III cluster containing phage encoded genes of unknown function (spy0961–0965). Type III clusters contain only genes of unknown or undefined function.

