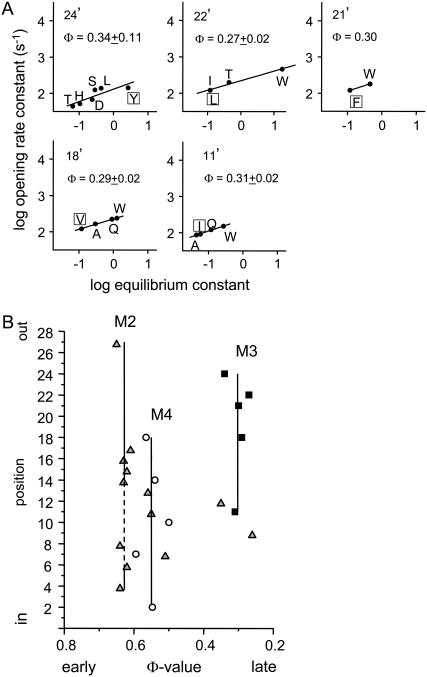
FIGURE 5.
Φ-values for αM3. (A) Rate-equilibrium free-energy relationships. Each point represents the mean value for at least three patches (Table 2). Φ (±SD) is the slope. Mutation of position 4′, 7′, and 8′ did not change the equilibrium constant significantly and no Φ-value could be estimated. (B) Φ as a function of position for M3 (squares), M2 (triangles) (8), and M4 (circles) (22). 24′ is the top and 1′ the bottom of the M3 helix (see Fig. 1). Φ is constant through the upper half (11′–24′) of αM3, with an average value of 0.30. Other regions of the AChR having Φ ∼ 0.3 include αM2 (9′ and 12′), ɛM2-9′, βM2-9′, ɛM4-14′, and δM2 (12′–18′).

