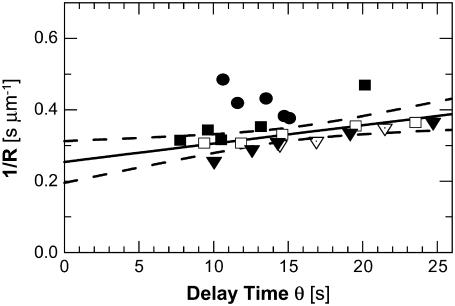
FIGURE 3.
Correlation between reciprocal fiber growth rate 1/R and delay time for nucleation θ at four HbS concentrations and different temperatures. (Circles) CHbS = 201 mg ml−1, (triangles) CHbS = 210 mg ml−1, (diamonds) CHbS = 220 mg ml−1, and (squares) CHbS = 230 mg ml−1, different fills correspond to different runs in the same solution; within a run, different data points are taken at different temperatures, which vary within ΔT = 5°C for each run. Solid line represents a linear fit through all points with an intercept A = 0.254 ± 0.027. Dashed lines show 95% confidence interval for this fit (i.e., in 95% of experiments the fit line is expected to lie inside the confidence interval). A t-test for the hypothesis that A = 0, i.e., 1/R is proportional to θ, gives a probability p < 0.0001.

