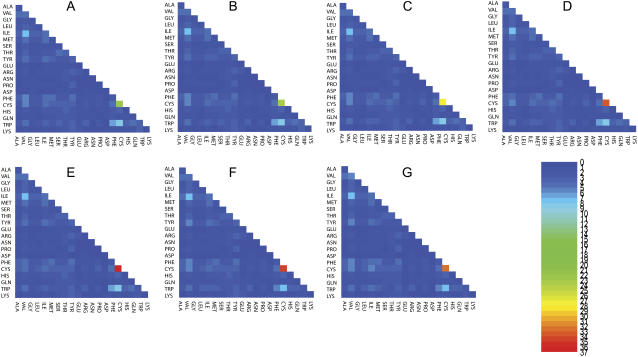
FIGURE 2.
The probability ratios (explained in pairwise tertiary contact analysis) for tertiary contacts among β-sheet secondary structures. The number key is given by the heat map. In the alphabetical order of the panels, from A to G, we display the probability ratios with different cutoff distances ranging from 5 Å to 8 Å with a 0.5 Å increment. Thus, panel A summarizes the results for using 5 Å as the cutoff distance, while panel G summarizes the results for using 8 Å as the cutoff distance.

