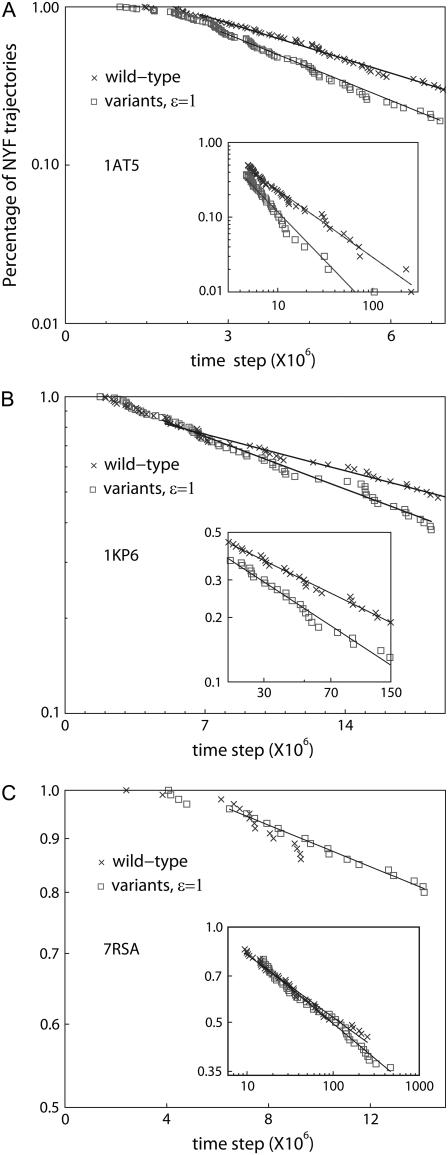
FIGURE 5.
Percentage of NYF trajectories versus time for the three proteins considered. Note that the percentage of NYF is always plotted in log scale while the time step is plotted in linear scale in the figure but in log scale in the insets. The exponents' α-values are obtained by fitting the power law in the insets. Both the α-values and the inverse characteristic timescales τ−1 are given in Table 4.

