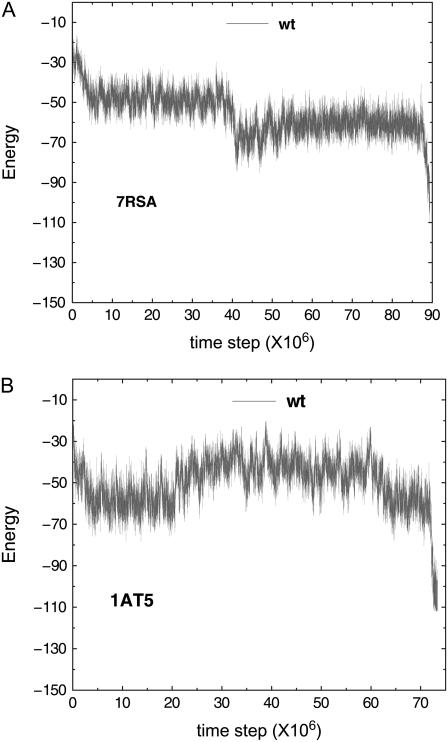
FIGURE 9.
Energy versus time step for wt protein models. Panel A plots the energy versus time of a slow folding trajectory from protein model 7RSA wt; the folding time of this trajectory is within the range describable by power law. Panel B plots the energy versus time of a slow folding trajectory from protein model 1AT5 wt; the folding time of this trajectory again is within the range describable by power law. These typical energy versus time plots do not show any clear descending trend in energy and thus do not lend support to the glassiness-free down-hill folding scenario. In particular, the typical energy differences, 2.9 and 3.4 units for 7RSA wt and 1AT5 wt, respectively, over a time interval of 1500 time steps for both trajectories are approximately one order-of-magnitude smaller than their respective peak-to-valley values.

