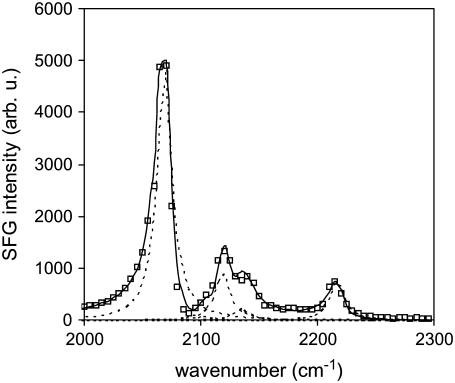
FIGURE 2.
SFG spectra collected from a dDPPG/DPPG bilayer on CaF2 in the C-D stretching range and the spectral fitting results. Square: experimental data; solid line: overall fitting results; dotted line: component peaks used in fitting. Spectral fitting was performed using Eq. S4 in the Supplementary Material. A nonresonant background of 2 was used in fitting.

