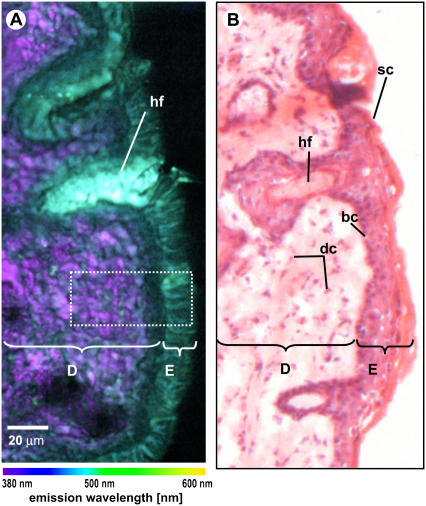
FIGURE 2.
(A) Spectral image of unstained mouse skin tissue section (thickness 20 μm; colors represent emission wavelength as indicated in the color bar). (B) Brightfield microscopic image of the subsequent H&E-stained tissue section. D, dermis; E, epidermis; hf, hair follicle; dc, dermal cells; sc, stratum corneum; bc, basal cells.

