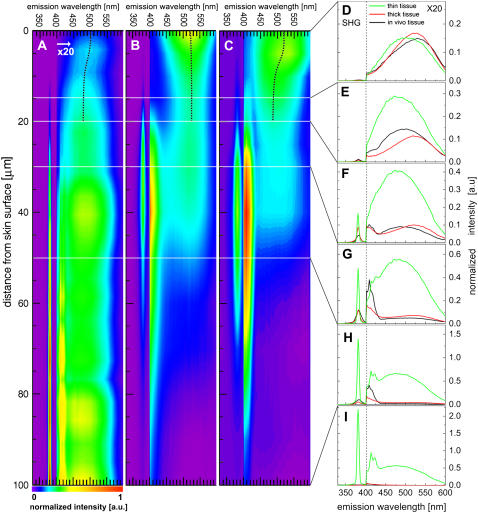
FIGURE 8.
Depth-resolved spectra of (A) thin excised tissue section, (B) thick excised tissue, and (C) in vivo samples of mouse skin. Colors represent normalized intensity as shown in the color bar. Representative spectra for the depths (D) 0 μm, (E) 10 μm, (F) 20 μm; (G) 30 μm, (H) 50 μm,and (I) 100 μm are also presented for the thin tissue section, thick excised tissue, and in vivo samples. Each color map or spectrum is divided into two spectral regions: 330–400 nm; and 400–600 nm; the longer wavelength region is multiplied by a factor of 20.

