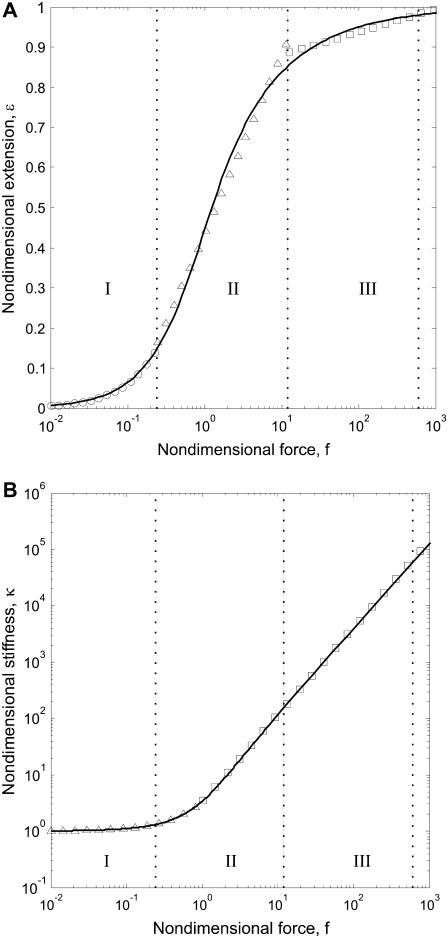
FIGURE 2.
(A) Extension as a function of force for the nondimensional WLC model. The solid line indicates an exact solution to Eq. 3. Circles, triangles, and squares indicate exponential, logarithmic, and polynomial approximations, respectively. Each approximation is accurate to ±10% in its force region, indicated by dotted lines. (B) Nondimensional stiffness as a function of force. The solid line is calculated from Eq. 5. Triangles and squares indicate linear and polynomial approximations, respectively. Force regions as in panel A. Typical experimental forces of between 1 and 50 pN correspond to the high force range (III) for a WLC with Lp = 50 nm (dsNA), and to the medium force range (II) region when Lp = 1 nm (ssNA).

