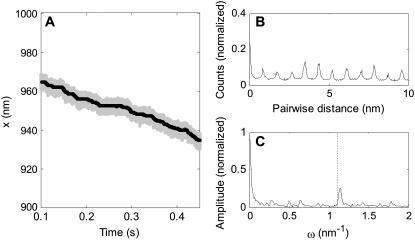
FIGURE 4.
(A) Typical simulated time-series (sampled data in shaded, filtered in solid representation). (B) Pairwise distance distribution (PWD) for the filtered data in panel A. (C) Fourier transform of the pairwise distance distribution (FTPWD) in panel B. Note that due to step attenuation, the peak in the FTPWD is displaced toward a higher spatial frequency compared to the frequency corresponding to ΔL (dashed line).

