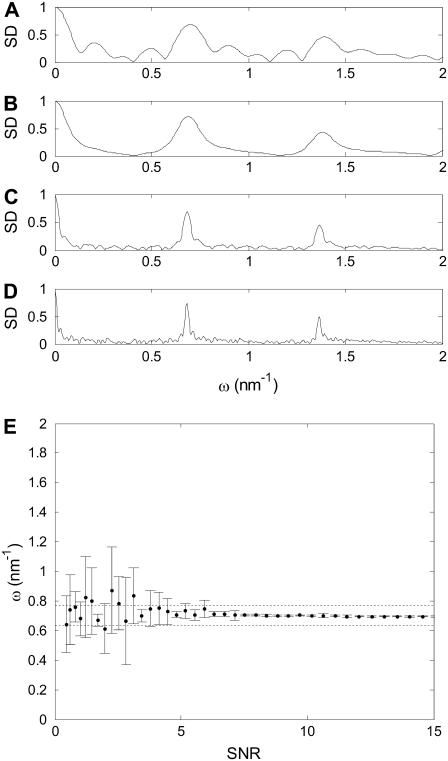
FIGURE 5.
(A–D) FTPWD graphs when analyzing time-series with different number of steps, to determine the influence of time-series length on the SD and the determined step length. A short time-series (five steps, A) results in multiple broad peaks. The false peaks are absent in the curve for 10 steps (B), but the main peaks remain broad. A time-series of 20 steps (C) shows well-defined peaks that allow step-length determination with 10% accuracy. Further lengthening the time-series (40 steps, D) improves step length measurement only little. All FTPWD curves show roughly equal SNR (the peaks are equally high). (E) Measured step length as a function of SNR. The average and standard deviation of the determined step length from 10 simulations is shown. Step length can be accurately determined when SNR ≥ 4. Dashed lines correspond to step lengths of 90 and 110% of the true (corrected for attenuation) step length.

