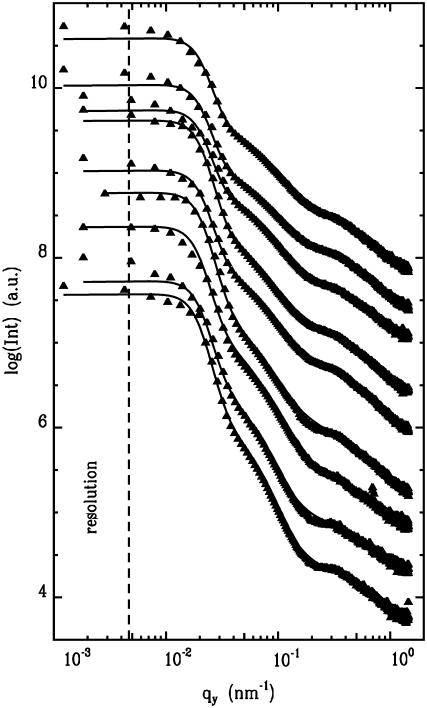
FIGURE 6.
Double logarithmic plot of the horizontal line cuts from the two-dimensional GISAXS signals (solid triangles) measured at casein films prepared at different Ca concentrations together with model fits (solid lines) as explained in the text. From the bottom to the top the added amount of Ca increases from 0 to 100 mM in steps of 10 mM (except 70 and 90 mM). The curves are shifted along the y axis for clarity. The resolution limit toward large length scales is shown by the dashed line.

