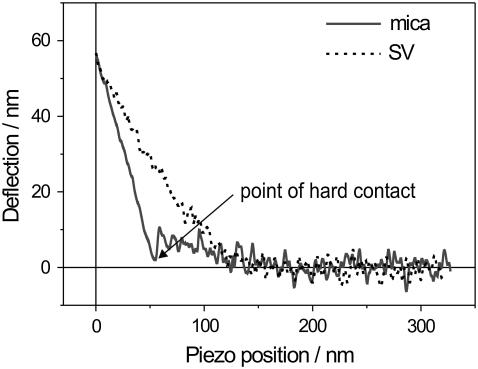
FIGURE 5.
Two typical cantilever-deflection versus piezo-position curves, acquired on the polylysine-coated mica substrate (dashed line) and at the center of a SV (solid line). Both curves were triggered to a deflection of ∼60 nm, corresponding to a maximum load of ∼0.4 nN, and are part of a 32 × 32 FV map.

